Many questions in DirectShow development are caused by lack of developer’s understanding what topology his code effectively built. Intelligent Connect and RenderXxx methods help adding and connecting filters and in the end a developer does not have a faintest idea what the pipeline looks like.
DirectShow API provides methods to enumerate filters, pins, connection and obtained detailed information about the filter graph. The API is well-documented. Then Windows SDK is shipped with GraphEdit which helps building graphs interactively. Ability to publish a graph on ROT and review it from GraphEdit is nothing but powerful. And then we have GraphStudioNext which makes everything even more convenient.
This does not seem sufficient and clear as many new questions and misunderstanding show that developers have false assumptions on graphs their applications use.
DirectShowSpy goes one step further with debugging options. With DirectShowSpy one can embed reviewing UI right into the developed application and either generate detailed textual description of filters, connections, media types as well as pass filter graph to GraphEdit/GraphStudioNext for interactive review with visualized topology. No excuses left any longer for misunderstanding built topologies.
Steps below explain in detail how to visualize your application DirectShow filter graph and generate a textual report on graph details.
1. For starters, one needs to intall DirectShowSpy in target system. Standard installation is mentioned in original post.
- It is necessary that DirectShowSpy of correct/matching bitness is installed. 32-bit applications use 32-bit DirectShowSpy and 64-bit applications – 64-bit DirectShowSpy. .NET applications built as “Any CPU” are effectively either 32 or 64 bit processes and respectively need a matching spy as well.
- To cut long story short, simply download
DirectShow*.*from Toolbox and use DirectShowSpy-Win32-reg-ui.bat or DirectShowSpy-x64-reg-ui.bat to pop up registration UI. You need local administrator privileges for the registration step (or spy is usable through COM otherwise but it’s beyond scope of this post).
2. DirectShowSpy’s FilterGraphHelper object (already mentioned earlier) offers DoPropertyFrameModal method to pop up diagnostic UI. The helper needs prior initialization with either graph, filter or pin interface. C++ code snippet:
#import "libid:B9EC374B-834B-4DA9-BFB5-C1872CE736FF" raw_interfaces_only // AlaxInfoDirectShowSpy
// ...
CComPtr<IFilterGraph2> pFilterGraph;
// ...
CComPtr<AlaxInfoDirectShowSpy::IFilterGraphHelper> pFilterGraphHelper;
ATLENSURE_SUCCEEDED(pFilterGraphHelper.CoCreateInstance(__uuidof(AlaxInfoDirectShowSpy::FilterGraphHelper)));
ATLENSURE_SUCCEEDED(pFilterGraphHelper->put_FilterGraph(pFilterGraph));
ATLENSURE_SUCCEEDED(pFilterGraphHelper->DoPropertyFrameModal(NULL));
C# code snippet:
IFilterGraph2 graph = new FilterGraph() as IFilterGraph2;
// ...
FilterGraphHelper helper = new FilterGraphHelper();
helper.FilterGraph = graph;
helper.DoPropertyFrameModal(0);
Downloadable sample projects (FilterGraphHelperDialog for C# and FilterGraphHelperDialog2 for C++) are available in Subversion repository or Trac.
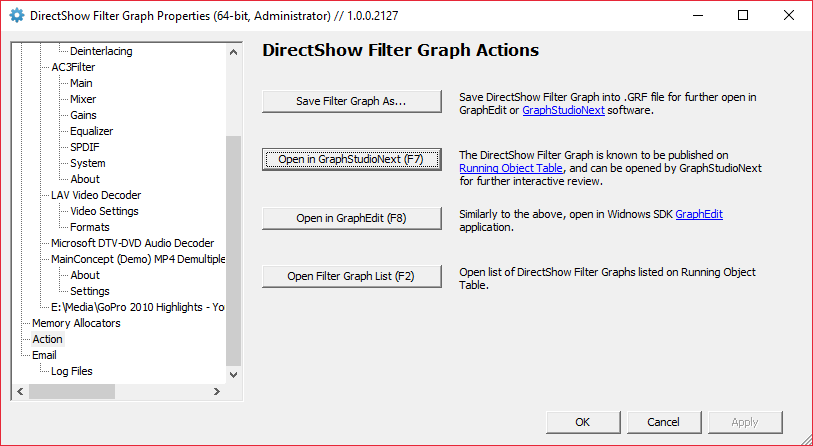
3. DoPropertyFrameModal methods opens a window (it’s argument is parent window handle, optional) with details about the graph, including copyable diagnostic text, filters and their property pages all gathered in single window.

NOTE: With root tree element “Filters” selected, the right-side pane contains the text that provides filter graph description (see image above)!
4. Additionally, it is possible to launch GraphEdit/GraphStudioNext with a hotkey and open – through ROT – the graph visually.

This requires that Windows SDK proppage.dll is available. It is normally registered with Windows SDK, and otherwise can be copied from SDK into target system and COM-registered using regsvr32. Or copied into the folder of DirectShowSpy in which case DirectShowSpy-Win32-reg-ui.bat (see item 1 above) file will see it and offer additional property page for registration.
5. When no longer needed, DirectShowSpy can be removed from system using the batch file mentioned above in item 1.
Whatever debugging you do with DirectShow filter graph, you need a complete understanding what filter graph you deal with. If you want to provide additional information to certain DirectShow related question, a copy/pasted diagnostic information needs to be attached to such question so that others understand what you are dealing with exactly.