libx264 illustrated

As libx264 has so many presets and tunes, I was curious how they all related one to another when it comes to encode video info H.264. I was more interested in single pass encoding for live video, so the measurements are respectively for this mode of operation with encoder running in CRF (constant rate factor, X264_RC_CRF).

So I took Robotica_1080.wmv HD video in 1440×1080 resolution and batch-transcoded into H.264 using libx264 (build 128) in various modes operation:

  • Presets: “ultrafast”, “superfast”, “veryfast”, “faster”, “fast”, “medium”, “slow”, “slower”, “veryslow”
  • Tunes: “film”, “animation”, “grain”, “stillimage”, “psnr”, “ssim”, “fastdecode”, “zerolatency”, “touhou”
  • CRFs: 14, 17, 20, 23, 26

It is worth mentioning that libx264 does EXCELLENT job in transcoding in terms of performance. Transcoding operation was a DirectShow graph of the following topology:

Some measurements are obviously not quite accurate because not only encoding time counts, WMV decoding time counts also etc. Still this should give a good idea how modes stand side by side one with another.

For every transcoding run I have the following values (Excel spreadsheet attached below):

  • Processor Time: number of processor-milliseconds spent on the transcoding; I was measuring in 8 core system, so with 100% load processor time could be up to eight times higher than Elapsed Time (below) provided that all cores were used in full
  • Elapsed Time: milliseconds spent on the transcoding; regardless of how many actual cores were in use, because original clip is 20 seconds long everything below that is faster than realtime processing
  • Output File Size: size of resulting MP4 video only file, some headers count as well however it is obviously mostly payload data; for a 20 seconds clip, 20 MB is 8 mbit/s bitrate

Another derivative value is:

  • Processor Time/Elapsed Time: which shows fullness of use of multicore system; some modes are clearly not using all available cores, while other do

Let us start watching pictures.

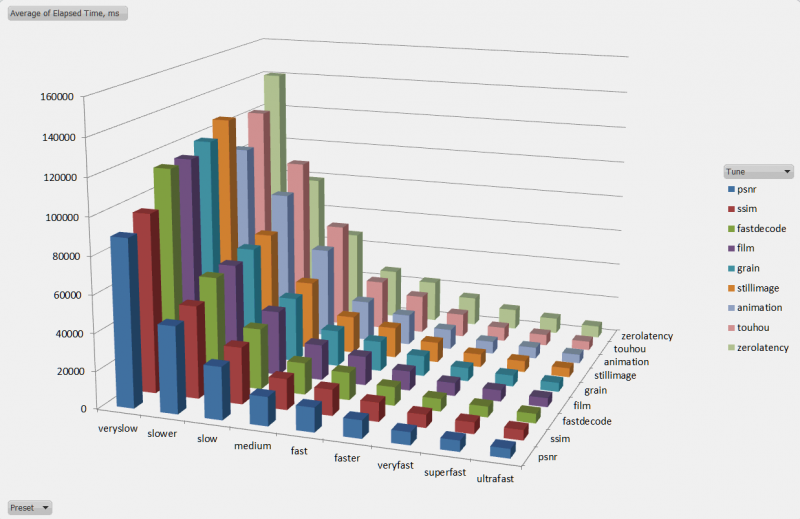
Average Elapsed Time for Preset/Tune (covers runs with different rate factors) shows that slow+ modes take exponentially more time for encoding. psnr and ssim tunes do transcoding slightly faster, while zerolatency tune is the most expensive.

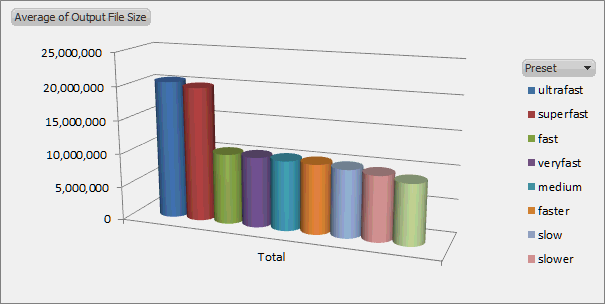
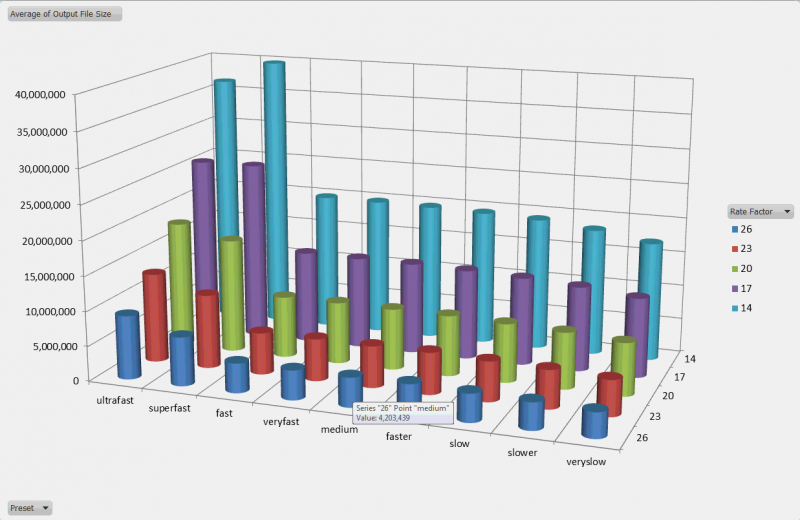
ultrafast and superfast presets produced significantly larger files, about 2x as large as other presets.

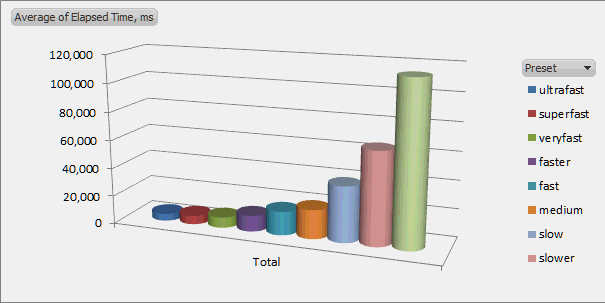
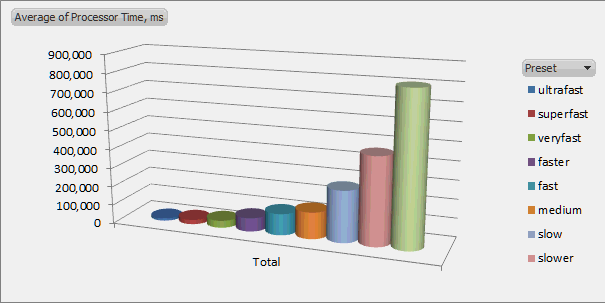
Once again exponential scale of Elapsed Time, and similar Processor Time chart:

It is worth mentioning that fastest presets are not using all CPU cores. Apart from being faster on their own, they leave some CPU time for other processing which can be useful for live encoding applications, and those processing multiple streams at once.

And finally detailed file size dependency from preset and CRF rate. As we already discovered, ultrafast and superfast produce larger stream, while output of other modes not so much differ (within a few percent, mostly on the slowest end). A step in rate factor of three gives about 0.7x decrease in amount of produces bytes.

More fun charts can be obtained from the attached .XLS file.

Download links:

Continuous realloc()

A colleague raised a question that realloc does better than free + malloc because allocated memory block is never being actually shrunk and reallocations to smaller size following by reallocations to larger (but still not larger than one of the previous) do not lead to heap locks and actual underlying heap memory block reallocations.

While this is technically possible within the contract declared by the API, it does not seem to be likely that the runtime will stay reluctant to release unused memory. And what is also highly probable, that heap managers implement advanced tricks to decrease impact of heap locks while doing memory allocations. In the same time, realloc must move the payload data in full to the new memory location in case the reallocated block is moved itself. If this is not required and the block is large, there is an unwanted performance impact to take place.

The details of the API operation are likely to be described somewhere, and another related question might be how to do the measurement programmatically and get a hint of what is going on internally.

PSAPI offers GetProcessMemoryInfo function to obtain process memory metrics, and returned PROCESS_MEMORY_COUNTERS_EX::PrivateUsage field is showing private memory in use. malloc allocated memory is eventually mapped onto process private memory, so the API is good for seeing approximate (because of fragmentation, process memory use is always higher than sum of actually allocated block sizes) memory usage.

If we are going to allocate 1 MB blocks, then reallocate to 1 KB, then allocate additional memory, observing the process private memory usage we will be able to see if realloc does release unused memory.

The code is as simple as:

PrintPrivateUsage();
VOID* ppvItemsA[256];
static const SIZE_T g_nSizeA1 = 1 << 20; // 1 MB
_tprintf(_T("Allocating %d MB\n"), (_countof(ppvItemsA) * g_nSizeA1) >> 20);
for(SIZE_T nIndex = 0; nIndex < _countof(ppvItemsA); nIndex++)
    ppvItemsA[nIndex] = malloc(g_nSizeA1);
PrintPrivateUsage();
static const SIZE_T g_nSizeA2 = 4 << 10; // 4 KB
_tprintf(_T("Reallocating to %d MB\n"), (_countof(ppvItemsA) * g_nSizeA2) >> 20);
for(SIZE_T nIndex = 0; nIndex < _countof(ppvItemsA); nIndex++)
    ppvItemsA[nIndex] = realloc(ppvItemsA[nIndex], g_nSizeA2);
PrintPrivateUsage();
VOID* ppvItemsB[256];
static const SIZE_T g_nSizeB1 = 16 << 10; // 16 MB
_tprintf(_T("Allocating %d MB more\n"), (_countof(ppvItemsB) * g_nSizeB1) >> 20);
for(SIZE_T nIndex = 0; nIndex < _countof(ppvItemsB); nIndex++)
    ppvItemsB[nIndex] = malloc(g_nSizeB1);
PrintPrivateUsage();

And the output is:

PrivateUsage: 0 MB
Allocating 256 MB
PrivateUsage: 258 MB
Reallocating to 1 MB
PrivateUsage: 3 MB // <<--- (*)
Allocating 4 MB more
PrivateUsage: 7 MB

Which shows that reallocating to smaller size involves freeing unused space.

Download links:

Password protected email correspondence

Friday evening there was an email from the bank with a document in attached password-protected archive. The new security rules “for our safety” require that bank officers never send potentially sensitive information to outside world without reasonable security measures. Makes sense? At the same time the protection is nothing but a burden to both sender and receiver, especially that both personnel and perhaps most of the customers have not faintest idea about communication security.

So what my bank does is the following. No they hardly know about certificates and things like email encryption, PGP etc. They use RAR to password protect a document and then attach the archive to the email. The recipient is supposed to communicate over different channel, such as over a phone call, and obtain the password to decrypt the contents.

Having received the document off the business hours, I was curious as for complexity of the chosen password. Yes I would call on Monday, but curiosity won at that time and the thing I was absolutely sure of was that the password is ridiculously simple and the whole safety is a fiction. Because there is a great deal of clients who can barely write down the password spelled on the phone because they are not familiar with Latin alphabet in first place. Then they might be messing characters that look or sound similar, put them in wrong case etc. And they are still respected customer the bank has to deal with. Now from the standpoint of bank clerk it is a pain to deal with a set of passwords so it is highly probable that in order to minimally meet security requirements, the person and even the whole department would apply the same password onto all the outgoing correspondence.

A dozen of obvious attempts with 1, 123, 111, 1234, 12345 did not work out well, so I scheduled brute force analysis tool to crack the thing.

It did not took much of time actually: the password was 111111.

DirectShow Spy: Who Sent EC_ERRORABORT?

persiflage@stackoverflow asks if there is a chance to use DirectShow Spy see who sent an EC_ERRORABORT notification, which filter exactly. Let us see first why there is no way to find this out, and then we will see what we can do.

DirectShow Filter Graph Manager accepts events from filters via its IMediaEventSink interface. The conversation taking place around event notifications is like this:

  • Filter: Hey, Graph Manager! Can I call you IMediaEventSink?
  • Manager: Yes, you can.
  • F: I notify you on EC_ERRORABORT event, here is HRESULT that I have: VFW_E_SOMETHING.
  • M: OK.

Filter graph manager (FGM) does not ask “Who’s taking?”. It does not need to know, it accepts information anonymously. Can a non-filter post an event? Absolutely, FGM does not have to care. This is simple, but when a question raised who posted the event, there is no answer for it – there was no such information in first place.

The good news through is that a developer does not need one hundred percent precision. The source of the event is important to understand which of the filters aborted streaming, and any information is helpful. Spy impersonates the whole FGM and as such it is capable of covering IMediaEventSink interface as well, in order to trace calls to the log file, and, even more helpful, trace call stack of the call which brought specific event in.

With the call stack information at the time of event notification, the filter of interest can be identified pretty precisely. Especially, having debug symbols available, so that Spy could provide symbols for the code locations on stack.

For instance, let us looks at Windows SDK AMCap Sample which previews video and uses video renderer, and hence has EC_VIDEO_SIZE_CHANGED event involved (just an example, spy from now on traces EC_ERRORABORT call stack only). Once this event reaches FGM, the call stack logged is:

FilterGraphSpy.h(850): CSpyT<class CSpy,&struct _GUID const CLSID_FilterGraph>::Notify: nEventCode EC_VIDEO_SIZE_CHANGED (0x0A), nParameter1 0x00F00140, nParameter2 0x00000000
  DirectShowSpy!6a3ba3b4 CSpyT<CSpy,&CLSID_FilterGraph>::Notify (+ 337) [d:\projects\alax.info\repository-public\directshowspy\filtergraphspy.h, 859] (+ 13) @6a3a0000
  quartz!6a243188 CBaseFilter::NotifyEvent (+ 46) @6a220000
  quartz!6a3394f6 CBaseControlVideo::OnVideoSizeChange (+ 56) @6a220000
  quartz!6a2a2f9a CRenderer::CompleteConnect (+ 175) @6a220000
  quartz!6a337668 CRendererInputPin::CompleteConnect (+ 25) @6a220000
  quartz!6a23a470 CBasePin::ReceiveConnection (+ 213) @6a220000
  quartz!6a2a3741 CVideoInputPin::ReceiveConnection (+ 92) @6a220000
  ksproxy!65e94dc0 CBasePin::AttemptConnection (+ 84) @65e70000
  ksproxy!65e94e81 CBasePin::TryMediaTypes (+ 104) @65e70000
  ksproxy!65e94f68 CBasePin::AgreeMediaType (+ 115) @65e70000
  ksproxy!65e966a0 CBasePin::Connect (+ 100) @65e70000
  ksproxy!65e7d711 CKsOutputPin::Connect (+ 381) @65e70000
  quartz!6a23252e CFilterGraph::ConnectDirectInternal (+ 233) @6a220000
  quartz!6a23847c CFilterGraph::ConnectRecursively (+ 44) @6a220000
  quartz!6a238d09 CFilterGraph::ConnectInternal (+ 331) @6a220000
  quartz!6a238c22 CFilterGraph::Connect (+ 23) @6a220000
  DirectShowSpy!6a3b8686 CSpyT<CSpy,&CLSID_FilterGraph>::Connect (+ 881) [d:\projects\alax.info\repository-public\directshowspy\filtergraphspy.h, 672] (+ 0) @6a3a0000
  quartz!6a2322f0 CEnumMediaTypes::Release (+ 39) @6a220000
  qcap!6a6c7a31 CBuilder2_2::DoesCategoryAndTypeMatch (+ 408) @6a6b0000
  qcap!6a6b3424 _GUID_00000000_0000_0000_0000_000000000000 (+ 4) @6a6b0000
  qcap!6a6cb9cb CBuilder2_2::RenderStream (+ 5294) @6a6b0000
  AMCap!01009723 @01000000
  AMCap!010041be @01000000
  AMCap!01005e27 @01000000
  AMCap!0100611c @01000000
  AMCap!01007600 @01000000
  AMCap!010076ba @01000000
  AMCap!0100a90d @01000000

It does not take a rocket scientist to see that event is posted by video renderer hosted by quartz.dll, which was a part of pin connection handling, where a pin of ksproxy’s filter – which has to be WDM Video Capture Filter – was connected to video renderer input pin.

DirectShow Spy started logging new items:

  • COM interface calls on filter graph IMediaEvent, IMediaEventEx, IMediaEventSink interfaces
  • Call staclk on IMediaEventSink::Notify call, with EC_ERRORABORT code (other codes are logged without call stack to reduce hook overhead and avoid logging stuff for no reason)

Download links:

Reading HRESULT codes

Although HRESULT codes are so common and structure is simple and well known, and even Visual Studio helps decoding the values nowadays, looking up for code takes some effort: hexadecimal value, searching through SDK headers or online, overlapped regions of codes in FACILITY_ITF etc.

HRESULT Code Structure

MSDN describes the codes in the following sections:

Now is there an answer to the challenge of easy decoding without routinely looking up Windows SDK every time? A helper system tray application makes a nice try. I used to use HR Plus (HR+) application for some time, but at some point even its small bugs started being annoying. Additionally, this one has a priority to decoding DirectShow, Windows Media and Media Foundation error codes.

So having the app started, copy HRESULT or plain system error code such as ERROR_ACCESS_DENIED (5) into clipboard, decimal or hexadecimal, and have it popped up. A click on the balloon googles for code details.

Let us see what is in there. We are using FormatMessage API to look for code message in the following order of preference: DirectShow, Windows Media, Media Foundation, Windows Sockets, WinTHTP, WinInet, System. If the code is found – and this really covers a huge number of codes, there might be additional lookup for the code identifier.

CString sTitle = _T("System"), sMessage, sIdentifier;
if(IsQuartzResult(nResult, &sMessage))
{
    sTitle = _T("DirectShow");
    sIdentifier = LookupQuartzIdentifier(nResult);
} else if(IsWmResult(nResult, &sMessage))
    sTitle = _T("Windows Media");
else if(IsMfResult(nResult, &sMessage))
{
    sTitle = _T("Media Foundation");
    sIdentifier = LookupMfIdentifier(nResult);
} else if(IsWs2Result(nResult, &sMessage))
    sTitle = _T("Sockets");
else if(IsWinHttpResult(nResult, &sMessage))
    sTitle = _T("WinHTTP");
else if(IsWinInetResult(nResult, &sMessage))
    sTitle = _T("WinInet");
else 
{
    sMessage = AtlFormatSystemMessage(nResult);
    sIdentifier = LookupSystemIdentifier(nResult);
    if(sIdentifier.IsEmpty())
        sIdentifier = LookupHresultSystemIdentifier(nResult);
}

If the code is found, it goes up into balloon notification.

The application decodes 6000+ HRESULT codes into human friendly state.

Download links:

Three ways to implement VBScript (VB6, VBA) callback from C++/ATL class

Suppose you have an automation object that needs to implement a callback into caller Visual Basic environment, which can be Scripting Host, Visual Basic for Applications, ASP etc. With all the late binding in VB scripting and so much different C++ code – how to put everything together? There are great choices, let us have three.

On all three samples we add numbers on the way:

  • 300 is the initial argument of the VB caller
  • 20 more in the VB callback
  • 1 adds the C++ COM class

The three .VBS files will output 321 is everything goes well. The C++ method name is OuterDo, while the supposed callback method is InnerDo.

There are two basic problems on the way:

  1. We have to somehow pass the callback to COM class
  2. We have to define function in a way that all they are compatible one with another

Callback in VB Class Function

Straightforwardly, we can pass VB class to have a method called back. While it might be a good idea with VBA where it might be possible to add a reference to type library and have the named callback interface available in scripting environment (VB’s Implements keyword), this does not work directly in VB Scripting Host. To work this around in .VBS sample we don’t reference IFirstSite interface, and the automation object First will access the method by its hardcoded name.

The source code has commented parts which can be used to connect the parts more strictly using IFirstSite interface.

Class FirstSite 
  'Implements IFirstSite
  Public Function IFirstSite_InnerDo(ByVal A)
    IFirstSite_InnerDo = 20 + A
  End Function
End Class

Dim First
Set First = WScript.CreateObject("AlaxInfo.VbsCallback.First")
Result = First.OuterDo(300, new FirstSite)
WScript.Echo Result

C++ implementation accepts the call using IDL syntax:

interface IFirst : IDispatch
{
    //[id(1)] HRESULT OuterDo([in] LONG nA, [in] IFirstSite* pSite, [out, retval] LONG* pnB);
    [id(1)] HRESULT OuterDo([in] LONG nA, [in] IDispatch* pSite, [out, retval] LONG* pnB);
};

In C++ we receive a COM interface of the class, and now we are to locate the callback method by its name using IDispatchEx interface. Once we succeed with this, we invoke a dispatch interface call.

Callback in VB Function

An alternate option is to pass separate function IDispatch interface and have it called from C++. compared to using strictly defined interface IFirstSite this might look like an inferior way, however considering the workarounds we have to put in method above to stay compatible with Scripting Host, this method might look even a bit simpler.

Function InnerDo(ByVal A)
    InnerDo = 20 + A
End Function

Dim Second
Set Second = WScript.CreateObject("AlaxInfo.VbsCallback.Second")
Result = Second.OuterDo(300, GetRef("InnerDo"))
WScript.Echo Result

On the caller side, the key to success is GetRef method that creates a IDispatch-enabled object from a separate function. C++ will use IDispatch::Invoke on DISPID of zero in order for the call to reach the implementation.

Callback through Connection Points

Connection points are standard and well known mechanism to deliver outgoing calls from an automation object, however they are subject to certain constraints:

  • late binding is taking place and we have to use IDispatch::Invoke to deliver calls, luckily Visual Studio is capable of generating proxy classes for that (no IFirstSite-like strictly defined and callable interfaces!)
  • connection points assume that there might be several parties connected to the points/events, and the interface should nicely supports this (no return values!)

Most of the environments have support for connection points on caller side, so this methods is nicely applicable.

Sub Third_InnerDo(ByRef C)
  C = C + 20
End Sub

Dim Third
Set Third = WScript.CreateObject("AlaxInfo.VbsCallback.Third", "Third_")
Result = Third.OuterDo(300)
WScript.Echo Result

In C++ there is a proxy class to deliver the event, so implementation is as simple as this:

// IThird
    STDMETHOD(OuterDo)(LONG nA, LONG* pnB) throw()
    {
        ATLASSERT(pnB);
        CComVariant vB(nA + 1);
        ATLVERIFY(SUCCEEDED(Fire_InnerDo(&vB)));
        ATLASSERT(vB.vt == VT_I4);
        *pnB = vB.lVal;
        return S_OK;
    }

Note that [out] parameters need to be VARIANTs or otherwise the returned values might get lost on the way.

So we are ready for a test run:

D:\Projects\Alax.Info\Repository-Public\Utilities\VbsCallback\Scripts>cscript First.vbs
Microsoft (R) Windows Script Host Version 5.8
Copyright (C) Microsoft Corporation. All rights reserved.

321

D:\Projects\Alax.Info\Repository-Public\Utilities\VbsCallback\Scripts>cscript Second.vbs
Microsoft (R) Windows Script Host Version 5.8
Copyright (C) Microsoft Corporation. All rights reserved.

321

D:\Projects\Alax.Info\Repository-Public\Utilities\VbsCallback\Scripts>cscript Third.vbs
Microsoft (R) Windows Script Host Version 5.8
Copyright (C) Microsoft Corporation. All rights reserved.

321

Good news, all three methods work well!

Visual C++ .NET 2010 source code [Trac, Subversion] is available from SVN. .VBS scripts are included.
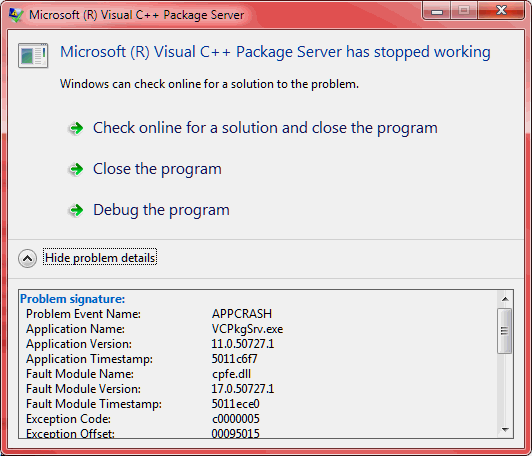
Double right angle bracket kills Visual C++ source code outlining in IDE versions 2008, 2010, 2012

An amusing bug which seems to be affecting three of the versions of Visual Studio in a row: 2012, 2010, 2008: a double right angle bracket closing (or just present) the declaration of templated base class is breaking Visual Studio outlining capability (code scout? Intellisense? whatever).

Have a space there and you are fine.